Root Cause Analysis
What is Root Cause Analysis?
Root Cause Analysis is a general approach to understanding the contributing factors or causes of an incident, such as development of MSD. It can help develop actions that remove hazards and sustain changes. A formal approach can get at more issues and help avoid missing important factors that can contribute to the incident. This will lead to a more effective solutions. Jumping straight to a solution – as it is people’s first instinct - will tend to lead to tunnel vision and ignore deeper causes. It is like the medical saying, “Treat the disease not the symptoms”.
Because a root cause analysis forces people to examine the specifics of the situation, as well as the technical, procedural and process context, it not only provides good insight into causes but it also sets the scene for developing solutions.
The two methods below describe team processes that assists a group in “brainstorming” or identifying underlying factors or causes of an incident, such as development of an MSD, or a near-miss
For a job where a worker is reporting and MSD or a Risk Assessment team who have identified an MSD hazard, two related ways of understanding the causes of the MSD hazard are described: 5-Whys and a Fishbone Diagram.
The “5-Whys” Tool for Root Cause Analysis
The 5-Whys is a simple brainstorming tool that can help groups identify the root cause(s) of a problem. Once a general problem has been identified, ask “why” questions to drill down to the root causes. Asking the 5-Whys allows teams to move beyond obvious answers and reflect on less obvious explanations or causes. Guard against a person using the 5-Whys questions on their own to avoid a narrow focus or bias.
How to do a 5-Whys analysis to determine Root Causes
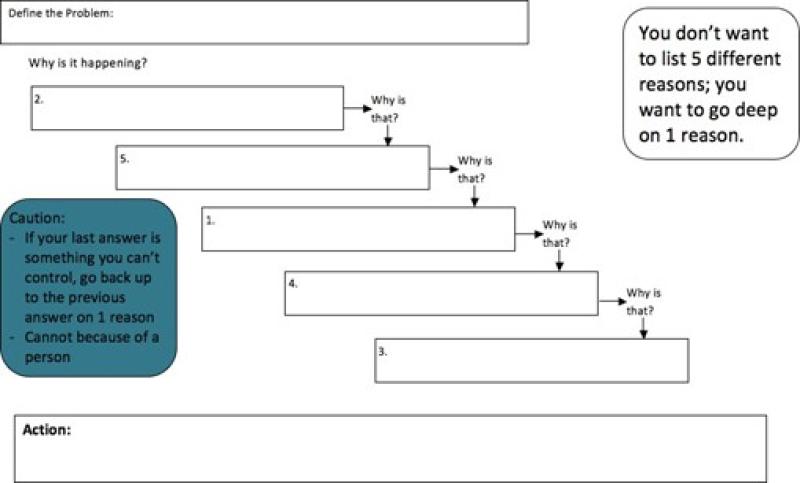
The team doing a 5-Whys analysis should carry out the steps listed below.
- State the problem you have identified as a strategic problem to work on. Stating the question itself as a why is a good start: Why did this situation or incident happen?
- Start asking “Whys” related to the problem. Like an inquisitive toddler, keep asking why in response to each suggested cause.
- Ask as many “Whys” as you need in order to get insight at a level that can be addressed. You will know you have reached your final “Why‟ because it does not make logical sense to ask why again.
It is said that by asking "Why?" five times successively, can you delve into a problem deeply enough to understand the ultimate root cause. By the time you get to the 4th or 5th why, you will likely be looking squarely at management practices (more than five whys may be required for complex problems).
Example #1 5-Whys Analysis (That could be improved).
Note: It would be an improvement to state the Problem as: Why do we have difficulty serving lunch? The Problem as given already directs focus to one issue only; staffing. Fortunately the questions led to a deeper understanding of the underlying issue.
Example #2 5-Whys:
A worker is seen to lift a package from floor level. Based upon “common knowledge”, many people will look to see if the worker has bent their knees. This naturally leads to a discussion of lift training as a countermeasure. Current evidence points to lift training being ineffective in preventing low back pain during lifting.
Those with training in ergonomics will “see” that the trunk is bent over – trunk flexion- and identify the lift as increasing risk of developing low back pain. What now? It has been said that identifying hazards is 10% of prevention (including MSD) and 90% of the work is in the reduction or elimination of the MSD hazard.
In order to reduce the risk of developing low back pain we need to identify the “determinants” or underlying reason(s) that the hazard of trunk flexion exists.
Why #1 Why is the worker bending over to lift?
Because the package is on the ground
Why #2 Why is the package on the ground?
Because the delivery driver put it on the floor
Why #3 Why did the delivery driver put it on the floor
Because there is nowhere else to put it
Why #4 Why is there is nowhere else to put it at a good height (between thigh and chest).
Because we were not aware that lifting from the floor substantially increased the risk of developing low back pain.
Why #5 Why didn’t we realize it?
Because our training was not up to date and we didn’t use the new MSD Guideline!
5-Whys Template
The “Fishbone Tool” for Root Cause Analysis
A cause and effect diagram, often called a “fishbone” diagram or Ishikawa diagram (after its inventor), can help in brainstorming possible causes of a problem and in sorting ideas into useful categories. A fishbone diagram is a visual way to look at cause and effect or identify the underlying causes so they can be tackled.
The problem or effect is displayed at the head or mouth of the “fish”. Possible contributing causes are listed on the smaller “bones” under various cause categories. A fishbone diagram can be helpful in identifying possible causes for a problem that might not otherwise be considered by directing the team to look at the categories and think of alternative causes. So that contributing causes are not missed and to bring deeper insight into the identified causes, be sure to have workers familiar with the work, engineers, managers and maintenance workers with knowledge of the processes and work-system participate.
How to Use a Fishbone Diagram to determine Root Causes:
The team using the fishbone diagram tool should carry out the steps listed below.
- Agree on the problem statement (also referred to as the effect). Be as clear and specific as you can about the problem. Stating the problem in the form of a question, such as “Why do workers on this task develop pain”. Making it a “why” question will help in brainstorming, as each root cause idea should answer the question. The team should agree on the statement of the problem and then place this question in a box at the “head” of the fishbone. Beware of defining the problem in terms of a solution (e.g., we need more of something).
- Agree on the major categories of causes of the problem:
4Ps: Policies, procedures, people and technology; widely adopted for cause- effects related to the service sector.
6M: Machines, methods, materials, measurement, mother nature (environment) and manpower; widely used for cause-effects related to manufacturing.
Processes, equipment, materials, environment and human-related .
You should adapt these categories or generate new ones to match your problem. The method does not depend on the names of the categories; their fit to your workplace and your problem is most important. The categories are drawn as “bones” or branches off the main “spine” of the fish
- Brainstorm all the possible causes of the problem. Ask Why does this happen? As each idea is given, the leader writes the causal factor as a branch from the appropriate category (places it on the fishbone diagram). Causes can be written in several places if they relate to several categories.
- Again ask “Why does this happen?” about each cause. Write secondary categories branching off the cause branches (see examples below).
- Continue to ask “Why?” and generate deeper levels of causes and continue organizing them under related causes or categories. This will help you to identify and then address root causes to prevent future problems.
- After asking “Why?” five times (and answering the question), root causes for most incidents are revealed. You may however stop asking “Why” when the why produces answers outside peoples control. For example in an analysis of a traffic accident the answer of “bad weather” is not controllable and so the why is not asked again. An example of a root cause might then be “no policy on driving in adverse weather conditions”.
Tips:
- Use the fishbone diagram tool to keep the team focused on the causes of the problem, rather than on the symptoms or the solution.
- Consider drawing your “fish” on a flip chart or large dry erase board.
- Make sure to leave enough space between the major categories on the diagram so that you can add more detailed causes later.
- Encourage each person to participate in the brainstorming activity and to voice their own opinions.
- When you are brainstorming causes, consider having team members write each cause on sticky notes, going around the group asking each person for one cause. Continue going through the rounds, getting more causes, until all ideas are exhausted. This can help members of the team who are less comfortable in the situation contribute their information.
- Note, as each category is explored, teams may not always identify problems in each of the categories.
- To help identify the root causes from all the ideas generated, consider a voting technique such as having each team member identify the top three root causes. Ask each team member to place three tally marks or colored sticky dots on the fishbone next to what they believe are the root causes that could potentially be addressed.
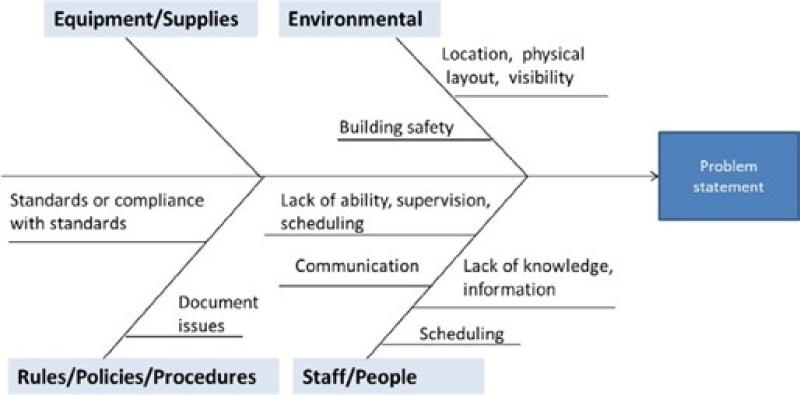
Examples:
Here is an example of the start of a fishbone diagram that shows sample categories to consider, along with some sample causes. The example of a completed fishbone diagram, showing information entered for each of the four categories agreed upon by this team.
Background:
- The incident was investigated and the following information was gathered from interviews, work observation, SOP etc. as available and appropriate:
- The aide was helping a resident transfer from her wheelchair to the toilet, without using a lift, and the resident fell, sustaining an injury.
- The resident was anxious and needing to use the bathroom urgently.
- The aide stated she did not use the lift because the battery was being recharged, and there was no extra battery available.
- The plan of care stipulated that the resident was to be transferred with two staff members, or with one staff member using a sit-to-stand lift.
- The aide stated she understood that the resident could be transferred with assist of one.
With this information, the team proceeded to use the fishbone diagram to better understand the causes of the event. The value of using the fishbone diagram is to dig deeper, to go beyond the initial incident report, to better understand what in the organization’s systems and processes are causing the problem, so they can be addressed; not just blaming the worker and recommending more training
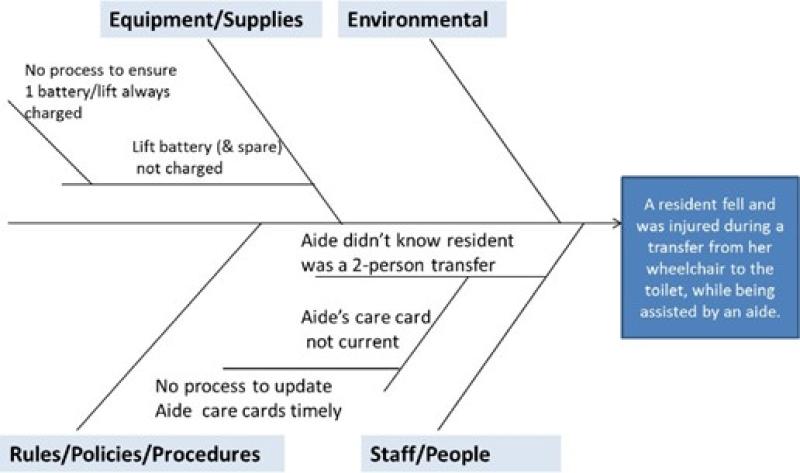
In this example, the root causes of the fall are:
- There is no process in place to ensure that every lift in the building always has a working battery. (One battery for the lift on this unit is no longer working, and the other battery was being recharged.)
- There is no process in place to ensure timely communication of new care information to the aides. (New transfer information had not yet been conveyed to the aide. The aide’s “care card” still indicated transfer with assist of one for this resident.).
- Note that there were no root causes noted in the “Staff/People” category for this example.
The root causes of the event are the underlying process and system problems that allowed the contributing factors to culminate in a harmful event. As this example illustrates, there can be more than one root cause. Once you have identified root causes and contributing factors, you will then need to address each root cause and contributing factor as appropriate.
Why use 5 Why or a Fishbone Diagram?
Both are brainstorming tools and have the goal of determining a cause. They are both useful with a group or team and where there is minimal quantitative information. 5-Whys can be used more easily on the shop floor or in a less structured setting as it requires no equipment. A fishbone diagram can be thought of as a more structured way of doing a 5-Whys and typically uses a whiteboard. The “5- Whys” technique is often used in conjunction with the fishbone diagram – keep asking why until you get to the root cause.
The fishbone diagram is particularly useful in a group setting. As people seem to jump straight to solutions, filling out the diagram structures the discussion around the underlying factors. The visual representation of a fishbone is itself a valuable aid and the categories keep the discussion organized.
Adapted from:
https://www.cms.gov/medicare/provider-enrollment-and- certification/qapi/downloads/fishbonerevised.pdf . Accessed March 27th 2018 A federal government website managed and paid for by the U.S. Centers for Medicare & Medicaid Services. 7500 Security Boulevard, Baltimore, MD 21244 https://www.isixsigma.com/tools-templates/cause-effect/cause-and-effect-aka- fishbone-diagram/ Accessed March 27th 2018 www.hqontario.ca/portals/0/documents/qi/rf-5-whys-tool-en.docx Accessed March 27th 2018